Geopandas Basics
Geopandas is a library for manipulating spatial data. The difference between geopandas and pandas is that a GeoDataFrame contains a GeoSeries with spatial data. The name of this GeoSeries is often 'geometry'. This spatial data has a coordinate reference system (CRS), typically EPGS: 4326 unprojected geographic coordinates, i.e. latitude/longitude. The CRS must be changed to a projected CRS for any spatial analysis or measurements. In this class, we will use EPSG:3857 WGS84 Web Mercator (Auxiliary Sphere) with units in meters.
The Geopandas library is NOT part of the anaconda application so you must install it in your environment before using it.
In the terminal window, enter conda install -c conda-forge geopandas.
There are two common formats for spatial datasets, namely GeoJSON and SHP. The easiest way to determine if an open dataset is a spatial dataset (contains coordinates) is to determine if it can be exported in either of these formats.
The open datasets in this example are GeoJSON format. In addition, the platform for the open datasets in this example is SOCRATA. Later exercises will work with ArcGIS REST services and the Census WMS.
The City of Buffalo, NY uses Socrata as its platform to provide open data. The web address is https://data.buffalony.gov/.
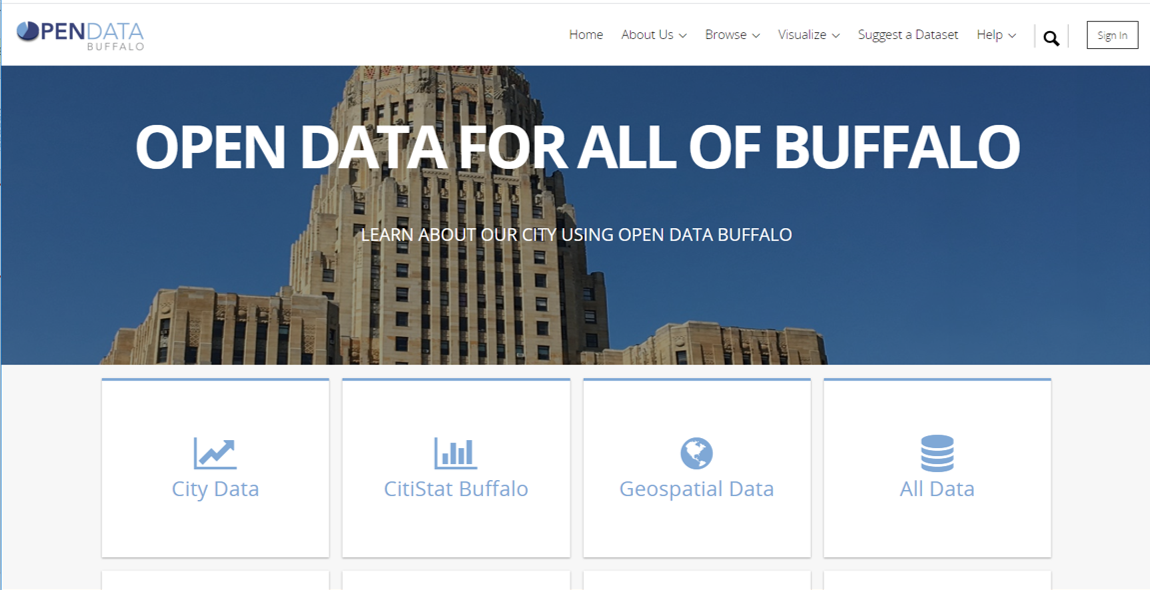
Geospatial Data provide location and ID information of geographic features and events. Attributes in these datasets are fairly limited. Most often, these datasets would be used in combination with other datasets. Notice that geospatial datasets are type Map.
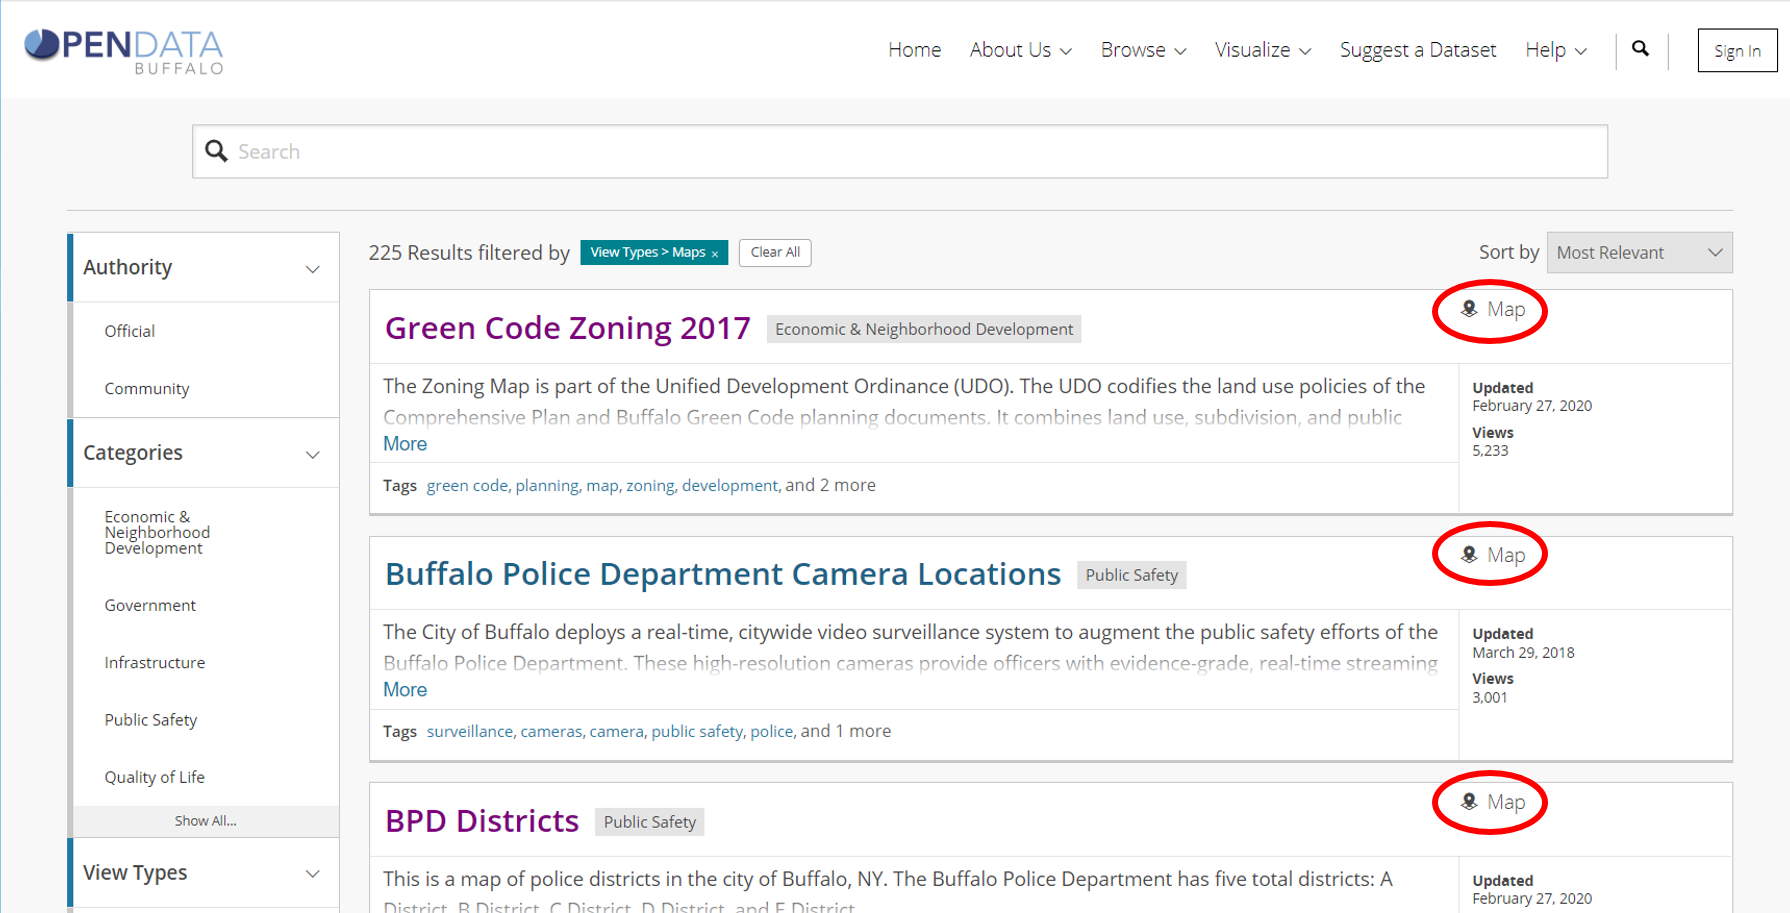
When you click on the name of a geospatial dataset, you will see a map of the geographic features. The image below shows the results of clicking on the Buffalo Police Districts map. The district polygons are shown over the Google basemap. If you click on a feature (polygon) a pop-up shows the attributes in the database.
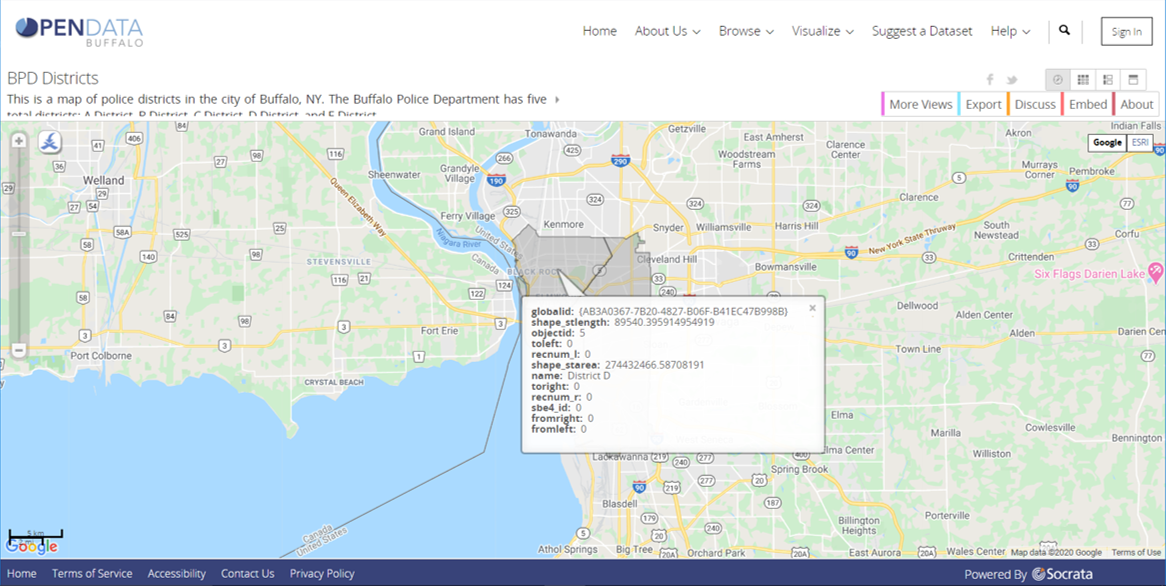
When you click on the EXPORT tab you will see that this dataset may be exported in shapefile or geoJson formats.
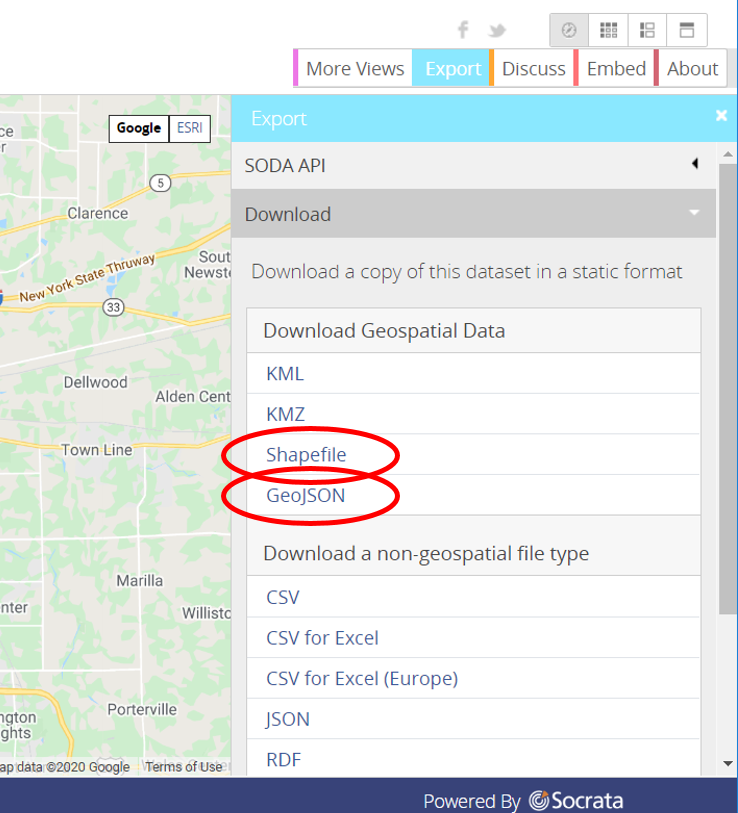
If you hover your mouse over either of these formats, right click - copy link address -you can paste the url into a text string to be read into a geodataframe.
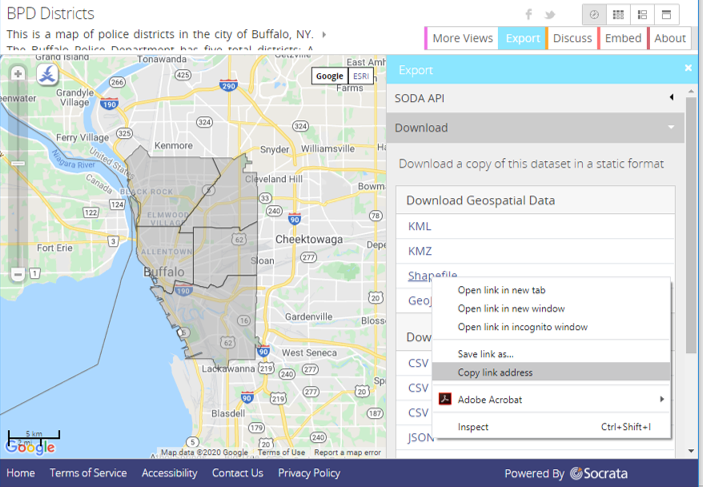
SEE BELOW
import os
import geopandas as gpd
import matplotlib
import matplotlib.pyplot as plt
%matplotlib inline
shp_url="https://data.buffalony.gov/api/geospatial/hggk-983r?method=export&format=Shapefile"
shp_gdf=gpd.read_file(shp_url)
shp_gdf.plot(column='name', figsize=(9,9));
shp_gdf.tail() #look at geodataframe, geometry column contains spatial coordinate data
Change CRS from unprojected lat/long to projected coordinates
shp_gdf.crs
shp_gdf=shp_gdf.to_crs('epsg:3857')
shp_gdf.geometry
shp_gdf.plot(column='name', figsize=(9,9)); #notice that the axes are in meters, not degrees lat/long
Use SODA API
Another approach to reading a geospatial dataset into a geopandas dataframe is to use the SODA API. In the export window, click on SODA API. Select the API Endpoint and copy (ctrl c) it to a string variable in your notebook. Change .json to geojson then read the file.
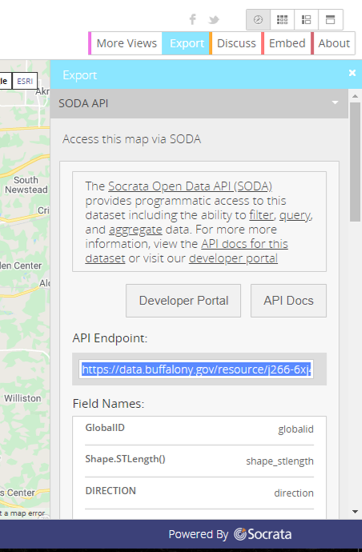
SEE BELOW
endpt_url="https://data.buffalony.gov/resource/j266-6xj4.geojson"
gj_gdf=gpd.read_file(endpt_url)
gj_gdf.plot(column='name', figsize=(9,9));
gj_gdf=gj_gdf.to_crs('epsg:3857')
gj_gdf.loc[gj_gdf.name=='District A'].plot(figsize=(6,6)); #same .loc as in pandas!
Other (non-map) Datasets
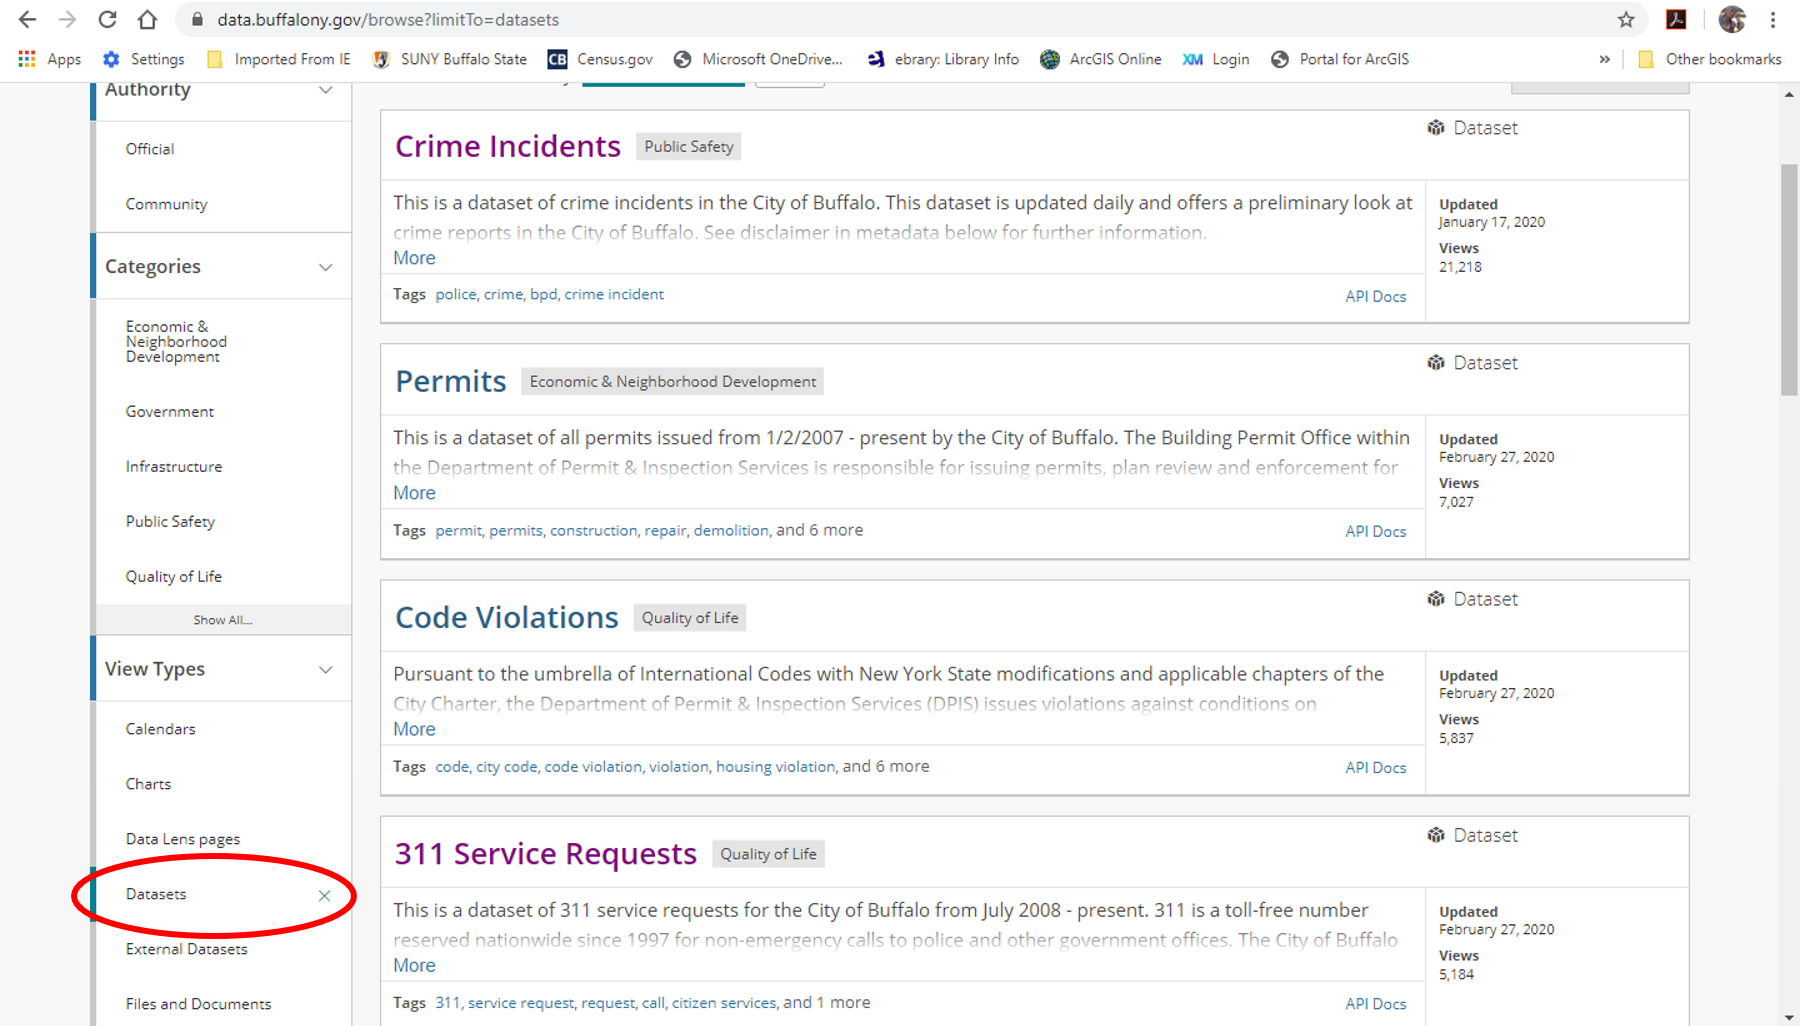
Many datasets contain spatial information (mostly point coordinates) but they are not presented as maps. Usually these tables contain a lot of attribute information about specific geographic events like vehicle crashes, pothole locations, or crime locations. There may be latitude and longitude fields (columns) in the table along with a location data type field. If a location datatype field exists, the data can be read as a geojson.
There are many ways to check if the dataset has geospatial location data. In the image below, the view Types has been set to Datasets. You can scroll through the datasets that are available or you can use a search tool to find datasets on a specific theme.
In the image below, the front page of the (housing) Code Violations dataset is shown. You may quickly determine if the dataset has location information by clicking on the API button, then the extension of the endpoint. If you see GeoJSON as a extension option, the dataset has location information. Change the extension to GeoJSON and click on the copy button to the right of the SODA API endpoint.
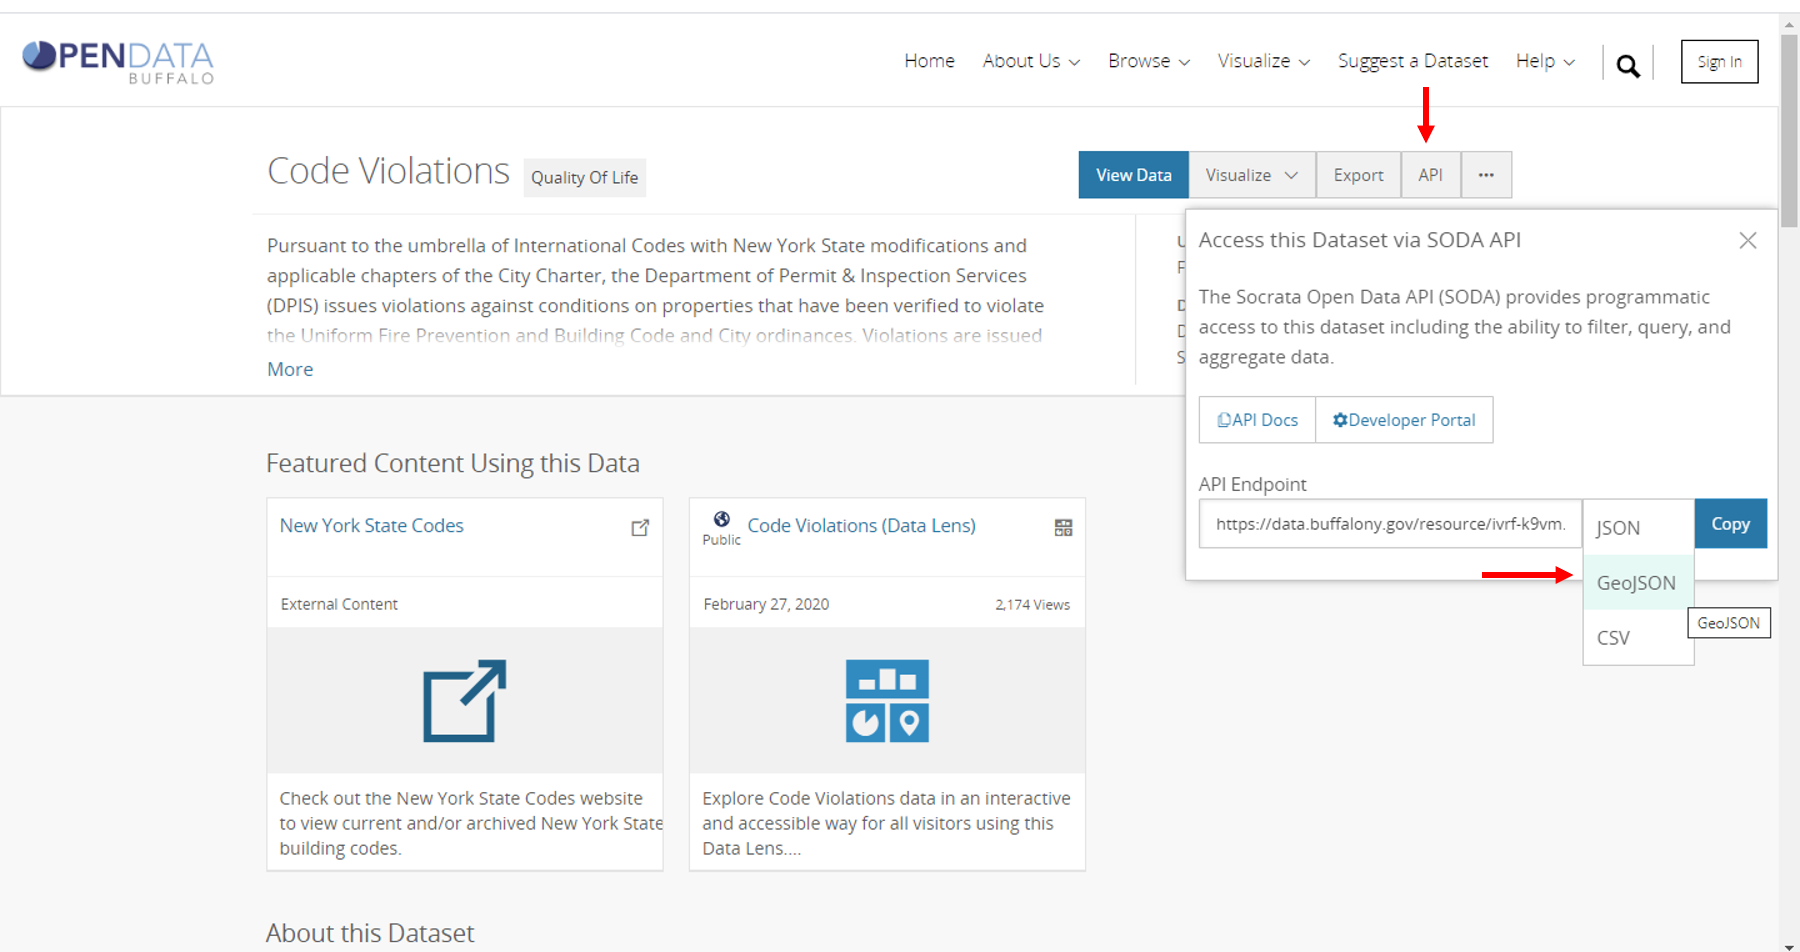
SEE BELOW
api_url="https://data.buffalony.gov/resource/ivrf-k9vm.geojson"
hcv_gdf=gpd.read_file(api_url)
hcv_gdf.tail()
RESET LIMIT
Notice that only 1,000 records were downloaded. Most data servers set a limit of 1,000 records or features. If you want more than 1,000 features from a Socrata dataset, append the query ?$limit=100000 to the url string.
You can see how many records are in the dataset either by scrolling down the home (metatdata) page of the dataset or by clicking on the VIEW DATA button and looking at the bottom right side of the window.
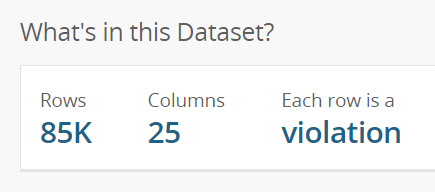
or
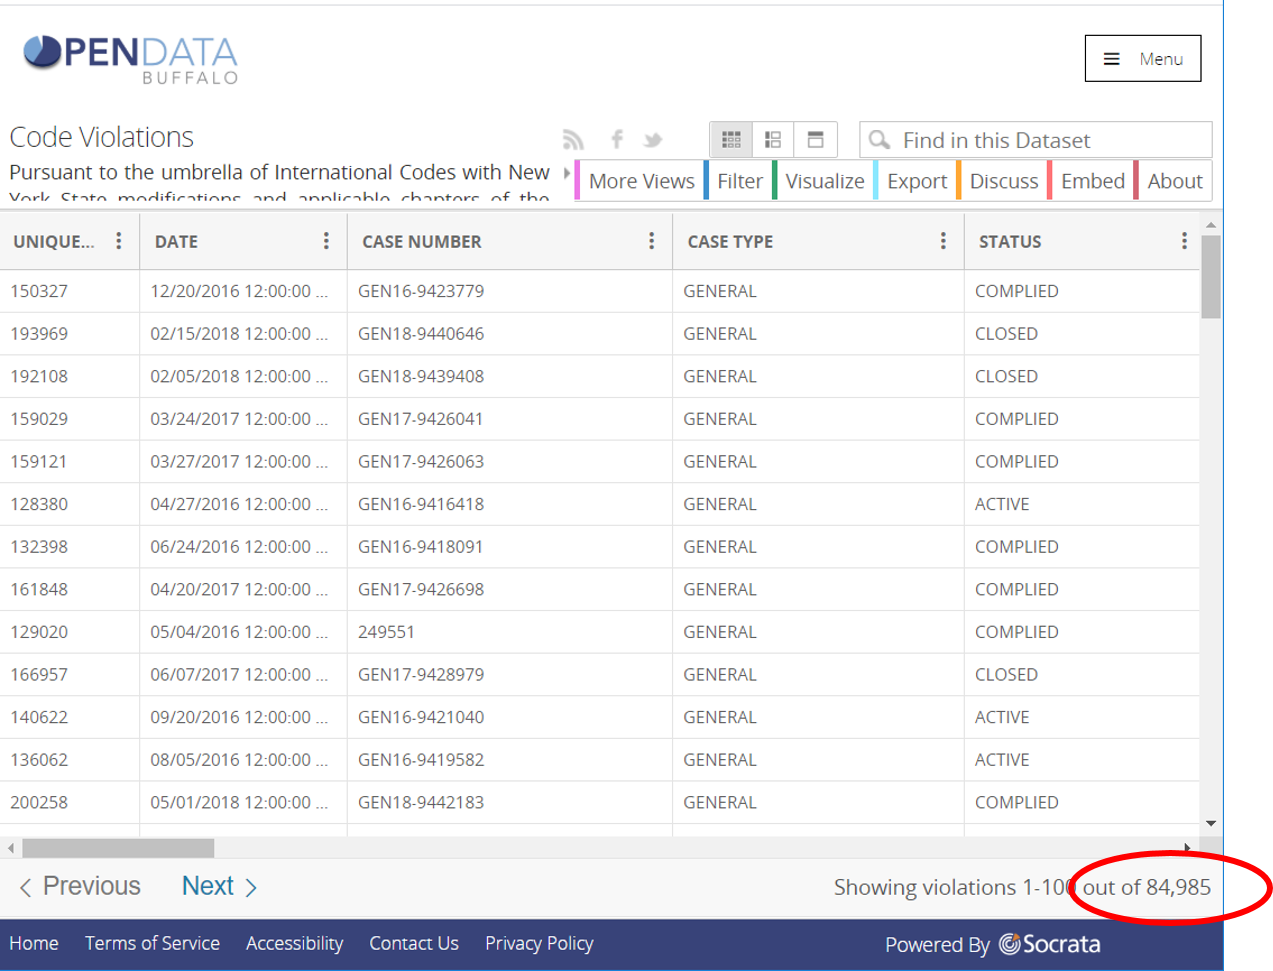
SEE BELOW
api_url="https://data.buffalony.gov/resource/ivrf-k9vm.geojson?$limit=1000000"
hcv_gdf=gpd.read_file(api_url)
hcv_gdf.tail()
hcv_gdf=hcv_gdf.to_crs('epsg:3857')
ERROR - NULL GEOMETRY CELLS
These null values must be removed from the dataset. Determine how many records are missing location information.
orig_rows = hcv_gdf.shape[0]
hcv_gdf = hcv_gdf.loc[hcv_gdf.geometry.notnull()]
hcv_gdf=hcv_gdf.to_crs('epsg:3857')
hcv_gdf.plot(column='council_district', figsize=(9,9));
print('Records with missing location information = {:,.0f}'.format(orig_rows-hcv_gdf.shape[0]))
Examples from class
Below are the other examples of reading spatial datasets from open data sources done in class.
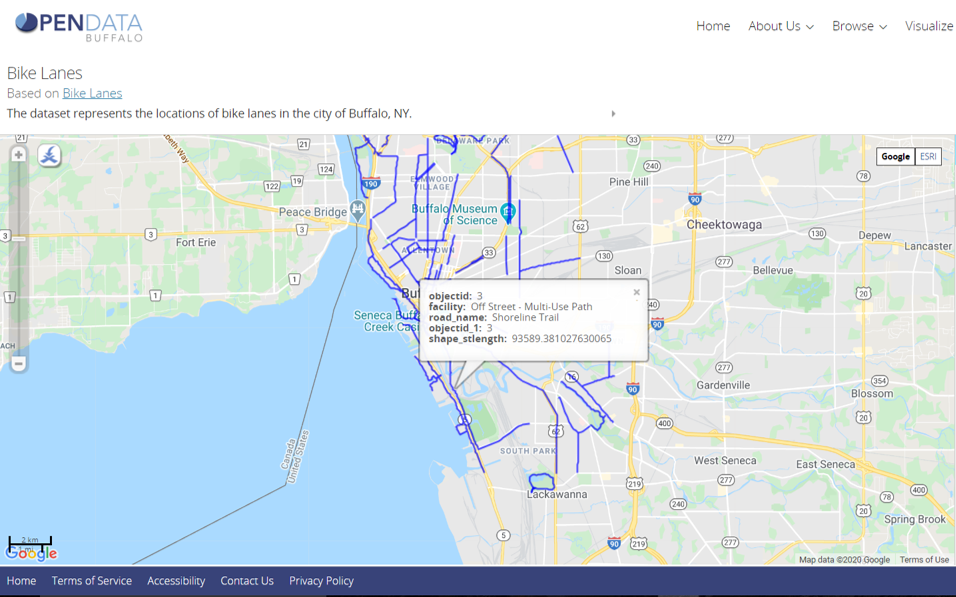
Buffalo Bike Lanes (Map)
Line data.
url2="https://data.buffalony.gov/resource/525g-icq5.geojson"
bikes=gpd.read_file(url2)
bikes.plot(column='facility',figsize=(9,9),legend=True);
bikes=bikes.to_crs('epsg:3857')
bikes.plot(column='facility',figsize=(9,9),legend=True);
Calculate line length
using Geopandas .length method. Since the units of the projection is meters, line length is in kilometers.
bikes['lengthkm']=bikes.geometry.length/1000
bikes.head()
Buffalo 311 Service Requests (Dataset)
Point data.


url311="https://data.buffalony.gov/resource/whkc-e5vr.geojson?$limit=1000000"
SR311=gpd.read_file(url311)
SR311.tail()
SR311=SR311.to_crs('epsg:3857')
orig_rows = SR311.shape[0]
SR311 = SR311[SR311.geometry.notnull()] #Remove records with missing location data
SR311=SR311.to_crs('epsg:3857')
num_miss=orig_rows-SR311.shape[0]
pct_miss= (num_miss/orig_rows)*100
print('Records with missing location information = {:,.0f}\nPercent of database = {:.1f}% '.format(num_miss,pct_miss))
SR311.plot(column='type',figsize=(9,9)); #legend too large, too many categories!
Assignment
Using the Open Data Network, read and display a point, line, and polygon dataset.
- Document each data set. Where it came from, how many records are in it, etc.
- Change the CRS to 3857. (Is location data available for all features/records?)
- For polygons, calculate area of each polygon in sq. km. (see geopandas .area).
- For lines, calculate the length of each line in km.
- Plot each dataset using an attribute field (column) to different features by color. If the legend isn't too large, turn it on.